Repeating Numbers: Understanding The Odds
Did you ever notice the KENO numbers seem to be "hot" and repeat? Are you seeing things? Maybe there is something to it.
Exactly What Are Repeating Numbers?
Simply put, repeating numbers are the numbers that appear in the last game and then reappear in the following game. I think everyone notices that numbers "seem" to come up in back-to-back-games, but is that coincidence or is there actually more to it? Let's take a look....
Numbers Don't Lie
If you look on our Repeating Numbers Statistics Page (bottom of page), you will notice that the most common occurence value of repeating numbers is (most likely) 5. This makes sense. Since the lottery draws 20 numbers (from last game) and there is a 25% chance for each number, 25% of 20 = 5.
Great! So now what? Well, if you look closer in the table below (taken from our New Hampshire Repeating Numbers Statistics Page), you will notice something interesting. The 6 repeating numbers is actually higher than the 5 at 22.33% and 21.00%, respectively. This means that there are 6 numbers repeating in back-to-back games at a rate of 22.33%. Interesting, isn't it?
Now, think about this for a minute. If there are 80 numbers in KENO, and 20 are drawn, we have a 25% chance of selecting one number correctly. But, what if we were to only select our numbers from the last game that appeared? The last game that appeared will contain 20 numbers, so let's focus on selecting from just those set of numbers.
| 0 Repeats | 1 Repeats | 2 Repeats | 3 Repeats | 4 Repeats | 5 Repeats | 6 Repeats | 7 Repeats | 8 Repeats | 9 Repeats | 10+ Repeats |
|---|---|---|---|---|---|---|---|---|---|---|
| 0 (0.00%) |
4 (1.33%) |
19 (6.33%) |
32 (10.67%) |
56 (18.67%) |
63 (21.00%) |
67 (22.33%) |
37 (12.33%) |
14 (4.67%) |
4 (1.33%) |
3 (1.00%) |
OK, so let's say the following numbers were drawn in last game: 06-10-11-15-23-24-33-34-36-39-43-48-51-52-56-59-73-74-75-79. Now, we focus on only these 20 numbers. Let's take a look at the odds from our table above.
The chances of 0 numbers repeating shows us a 0% chance, so we know pretty well that at least one number will repeat. The average chance is that 5 numbers will appear from this set. But based upon our percentages above, let's see if we can find an advantage.
Here comes some math: if we take all of the percentages of more than 5 numbers to appear (6,7,8,9,10+) we get (22.33 + 12.33 + 4.67 + 1.33 + 1.00) 41.66%. So this means there is a 41.66% chance of more than 5 numbers repeating. Now if we add in the 5 numbers to that total (41.66 + 21.00), we get 62.66%. This means that narrowing our draw for 80 numbers down to 20 numbers, we have a statistical advantage. 62.66% of the time 5 or more numbers will repeat. Wow!
Conversely, if we add up the times numbers are less than 5 to appear (0,1,2,3,4) we get (0 + 1.33 + 6.33 + 10.67 + 18.67) 37.00%. This means that 37% of the time if we select from the last game, we would be in a disadvantage. This gives us an advantage of 4.66% (41.66% - 37.00%) when selecting from the previous game!
More Than Just Coincidence
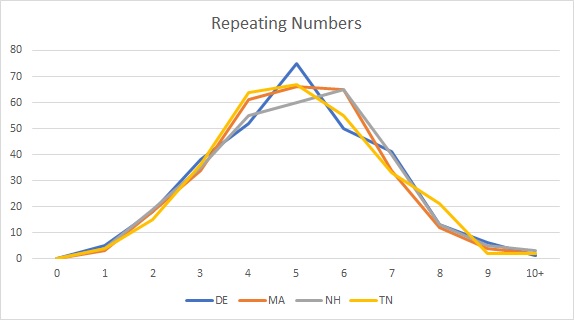
This sounds too good to be true! However, if we look at the statistics from the 4 states we currently have on our site, we can see from Figure 1 below, that these statistics are consistent across all 4 states. You can use our Repeating Numbers Statistics Page at any time to confirm that this holds true. Simply enter a historic game number into the form and see that the numbers don't lie.
What does this mean?
If you haven't tried the repeating number strategy before, maybe it is time you look into it, or at least combine it with another strategy you use. After all, any edge we can find could be the difference between losing and winning big!